
📊 Understanding Skewness & Kurtosis
🎯 What is Skewness?
Skewness tells us whether the data leans more towards one side — like a seesaw!
Purpose: To understand whether most values are packed on one side and if extreme values (outliers) are pulling the average.
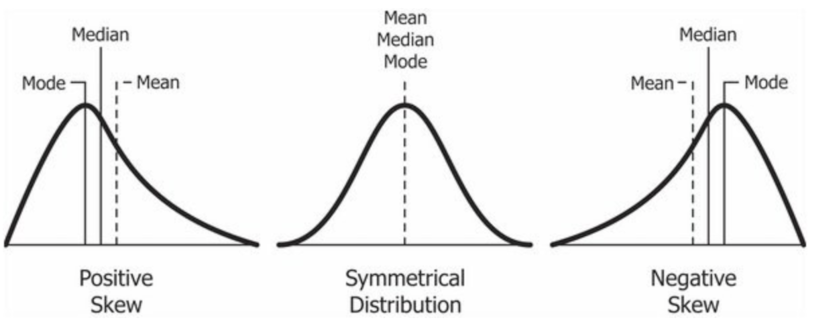
- Symmetrical Data: Mean = Median = Mode (e.g., Heights of students in a class)
- Positively Skewed (Right Skewed): Long tail on the right → (Mean > Median > Mode)
Example: Income levels (few very rich people pull the average up) - Negatively Skewed (Left Skewed): Long tail on the left ← (Mean < Median < Mode)
Example: Age at retirement (most retire at a similar age, some earlier)
Formula: Skewness = Σ(x − x̄)³ / (n × σ³)
🎢 What is Kurtosis?
Kurtosis tells us how pointy or flat the data curve is — like comparing a tall mountain to a flat hill!
Purpose: To measure how much of the data is in the center vs. the tails. It helps detect extreme outliers.
- Mesokurtic (Normal Kurtosis = 3): Balanced data — like a gentle hill
- Leptokurtic (Kurtosis > 3): Tall, thin peak — more values in the tails (e.g., exam scores with lots of failures and full marks)
- Platykurtic (Kurtosis < 3): Flat and spread out — fewer extreme values (e.g., random guesses on a quiz)
Formula: Kurtosis = Σ(x − x̄)⁴ / (n × σ⁴)
Excess Kurtosis = Kurtosis − 3 (Used to compare with normal curve)
📌 Summary Table
| Feature | Skewness | Kurtosis |
|---|---|---|
| Tells us about | Direction of spread | Peakedness or flatness |
| Useful for | Detecting lean or bias | Detecting outliers |
| Formula base | Third moment | Fourth moment |
🧠 Tip for Students:
Skewness = "leaning" data 📉 | Kurtosis = "peaked" data ⛰️
Both are important for understanding the **shape** and **extremes** in data!
📊 Skewness – Explained Visually
📊Kurtosis – Explained Visually
Use these images to remember: Skewness = tilt, Kurtosis = peakedness.